Debugging and diagnostics are vital skills for any developer, but they can also be difficult and time-consuming to get proficient . That’s why we’ve added some fantastic new features and enhancements to Visual Studio 2022 v17.11 that will help you find and resolve bugs faster and easier than ever before. Here are some of the highlights. Download this update and see the release notes for all the details.
Debugging
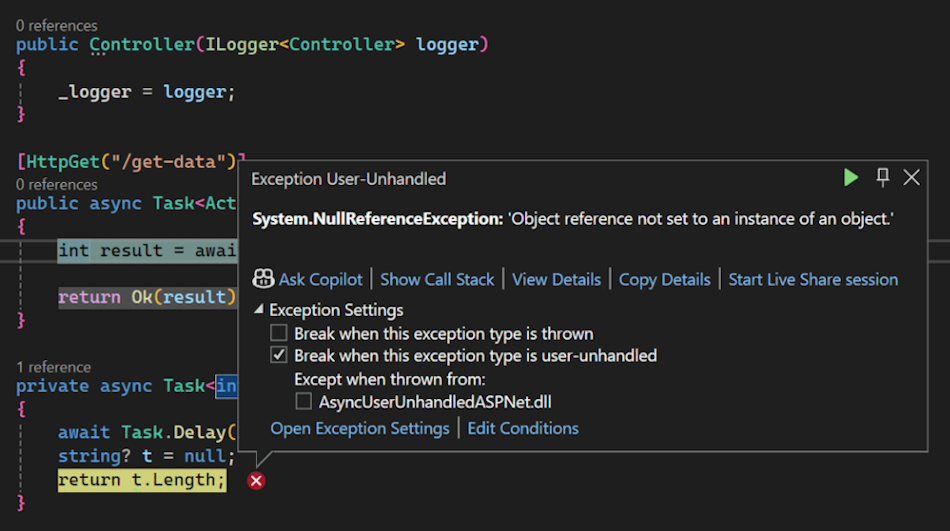
Break on async method exceptions
Debugging asynchronous code, especially in frameworks like ASP.NET, can be tricky due to the potential for exceptions to be thrown across asynchronous boundaries.
Now, with Visual Studio Debugger it automatically breaks when an async Task method throws an exception back to framework code.
AI-generated breakpoint expressions
AI-generated expressions for conditional breakpoints and tracepoints are now supported in C++. GitHub Copilot analyzes your code and offers insightful breakpoint expressions, streamlining your debugging process.
Debug AnyCPU applications manifested to run as arm64
Visual Studio natively supports building and debugging Arm64 apps on Arm-based processors. Unfortunately, applications built with the AnyCPU setting running on an Arm64 machine will default to using x64 emulation. While the capabilities of the x64 emulator have expanded, the most efficient Arm CPU scenarios are supported when applications are running natively.
To better support the intended native behavior the Windows 24H2 update introduces a new <supportedArchitectures> setting for your App manifest files. .NET developers can include a list of supported architectures (amd64 or arm64), explicitly signaling that an application built with the AnyCPU setting should run natively using the Arm64 CLR on Arm64 devices.
Blazor WebAssembly debugging
This release features a preview of the improved debugging experience for Blazor WebAssembly apps targeting .NET 9 or later.
Organize your breakpoints with default breakpoint groups
Breakpoint groups allow you to customize and toggle breakpoints for faster and more effective debugging.
You can now mark the selected breakpoint group as the default, ensuring all newly added breakpoints are automatically included in that group.
Edit and visualize LINQ expressions in the IEnumerable visualizer
The Visual Studio debugger now offers an editable expression feature in the IEnumerable visualizer, a powerful enhancement for developers working with collections.
Improved performance of conditional breakpoints in C++
We have significantly enhanced the performance of conditional breakpoints in C++ through a reworked implementation.
Our initial assessment shows a performance improvement of at least 35% in version 17.10 and 70% in version 17.11, reducing execution time from 80 seconds to 21 seconds over 80,000 iterations.
Profiling
Keep your target selection in the instrumentation tool between runs
The instrumentation tool now persists the target selection between runs offering a significant benefit by enhancing the continuity of profiling sessions.
With this improvement, you can maintain your specified target across multiple instrumentation runs, removing the need for repetitive selection tasks.
Decompile .NET assemblies
Visual Studio profiler now offers auto-decompilation for .NET libraries in scenarios where source code is unavailable. By automatically decompiling code during source lookup, even without loaded symbols or exact file locations, you can gain insights into the code’s structure and performance issues.
With this new feature, while visualizing a collection or dataset, you can directly edit the expressions textbox on the top of the dialog with your desired LINQ expressions. The visualizer updates in real-time, reflecting the data change resulting from your query.
We hope you enjoy this update to Visual Studio, and we look forward to hearing what you think. You can share feedback with us via Developer Community, by reporting issues via report a problem and share your suggestions for new features or improvements to existing ones.
Stay connected with the Visual Studio team by following us on Twitter @VS_Debugger, Twitter @VisualStudio, YouTube, and LinkedIn and on Microsoft Learn.
Thank you for using Visual Studio and happy coding!