
Ever wished to assess your code’s performance without repeatedly choosing the target process or executable for each instrumentation profiling session? If so, you’re among many developers who find this task cumbersome and prone to errors, especially when profiling the same target repeatedly.
We understand your frustration and have a solution: Visual Studio 2022 introduces a new feature that addresses this issue. The instrumentation tool now remembers your target selection across runs, providing a seamless experience and enhancing the continuity of your profiling sessions.

With this improvement, you can maintain your specified target across multiple instrumentation runs, eliminating the need for repetitive selection tasks. This means you can focus more on analyzing the performance data and optimizing your code, rather than wasting time and effort on setting up the profiling session.
How does it work?
To use this feature, you need to have Visual Studio installed and the Performance Profiler (ALT+F2) enabled. Then, follow these simple steps:
- Launch the Performance Profiler and select Instrumentation as the profiling method.
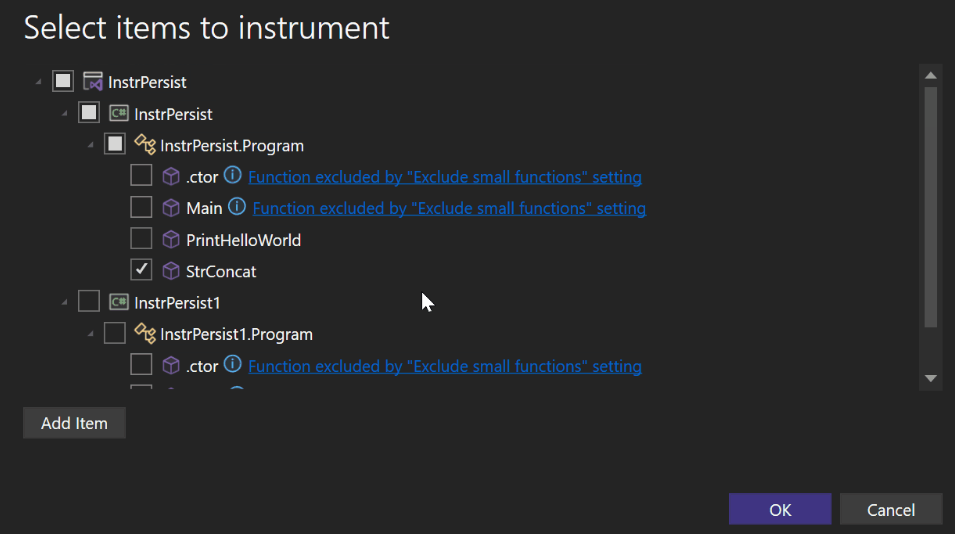
- Click the Target button and choose the process or executable you want to profile.
- Click Start to begin the profiling session. Visual Studio will collect and display the performance data in the Diagnostic Tools window.
- When you’re done, click Stop to end the profiling session. Visual Studio will show you a summary of the results and allow you to drill down into the details.
- Click cancel in the dialog box to reset the persisted selection.
If you want to run another instrumentation profiling session on the same target, you don’t need to select it again. Just click Start and Visual Studio will remember your last choice and use it as the default target. When you add a new method, class, or project, these new targets are automatically selected based on whether their parent was previously selected. This proactive approach ensures that no new additions are missed and helps maintain comprehensive profiling coverage.
You can still change the target if you want to, but you don’t have to.
Enjoy the convenience and efficiency of persistent target selection!
Why should you use it?
This feature is designed to help you streamline your workflow and improve your productivity when using the instrumentation tool. By persisting the target selection between runs, you can:
Save time and avoid frustration by reducing the number of clicks and interactions needed to set up a profiling session.
Minimize the risk of selecting the wrong target or forgetting to select one, which could lead to inaccurate or missing performance data.
Maintain consistency and comparability of the performance data across multiple profiling sessions on the same target.
Focus more on the performance analysis and optimization of your code, rather than the configuration and management of the profiling session.
Concluding thoughts
We hope you find this feature valuable for your development journey. Your feedback and suggestions are invaluable to us as we strive to enhance it further. Please share your thoughts through the Visual Studio Developer Community or the Report a Problem tool in Visual Studio.
Thank you for choosing Visual Studio and for your continuous feedback that helps us make it better every day.
Stay connected with the Visual Studio team by following us on Twitter @VS_Debugger, Twitter @VisualStudio, YouTube, and LinkedIn.